How to Measure B2B SaaS Product Success Beyond Basic Vanity Metrics
Measuring B2B SaaS product success requires shifting focus from individual user behavior to account-level health. While consumer apps prioritize daily active users (DAU), B2B platforms must track metrics that predict organizational retention and expansion. The most effective frameworks prioritize Net Dollar Retention (NDR) as a lagging indicator of financial health, while utilizing Time to Value (TTV) and Feature Displacement as leading indicators of product adoption. As of 2026, a highly competitive B2B SaaS activation rate sits near 37.5%, with successful products achieving an "Aha! Moment" within the first 36 hours of deployment.
Product management in the business-to-business (B2B) software sector operates under a fundamentally different set of economic rules than consumer applications. In a landscape characterized by multi-month sales cycles, procurement committees, and annual contracts, relying on traditional consumer metrics often leads to a false sense of security.
A high volume of daily logins might look impressive on a dashboard, but if those logins are restricted to a single junior employee within a 5,000-person enterprise account, the risk of churn remains exceptionally high. To build a sustainable growth engine, product teams must implement a structured framework that accurately reflects how organizations—not just individuals—derive value from software.
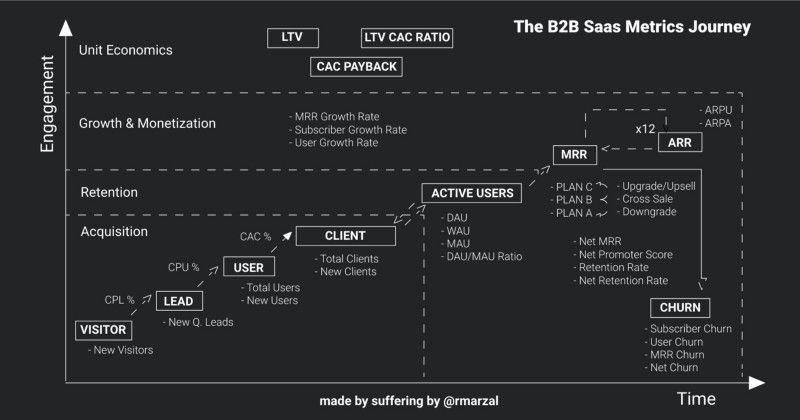
Image source: NextScenario
Why B2B SaaS Product Metrics Require an Account-First Perspective
The most common pitfall for B2B product managers is the "User vs. Account" conflict. In consumer software (B2C), the user and the buyer are the same entity. In B2B SaaS, a "customer" is an entire organization. This distinction means that user-level metrics must always be aggregated and contextualized at the account level.
Consider a scenario where a SaaS platform has 100 Daily Active Users (DAU). In a B2C context, this is a straightforward engagement metric. In a B2B context, 100 DAU could mean two very different things:
- Scenario A: 100 users spread evenly across 20 different enterprise accounts (Healthy breadth).
- Scenario B: 95 users concentrated in a single account, with 5 users scattered across the remaining 19 accounts (High churn risk).
To accurately measure adoption, product teams must evaluate both the Breadth of Adoption (how many distinct departments or licensed seats within an account are active) and the Depth of Adoption (how many core, high-value features the account utilizes regularly). According to financial operations platform Maxio, failing to distinguish between user activity and account health obscures true revenue retention risks.
To solve this, leading product teams develop an Account Health Score. This composite metric aggregates individual user data into a single, predictive score for the entire organization. A robust Account Health Score typically weights several factors:
- Percentage of allocated licenses actively deployed (Breadth)
- Frequency of core feature utilization (Depth)
- Recent support ticket volume and resolution times
- Executive sponsor engagement (e.g., logging in to view ROI dashboards)
| Metric Category | B2C / User-Level Metric | B2B / Account-Level Equivalent |
|---|---|---|
| Engagement | Daily Active Users (DAU) | Active Accounts / License Utilization Rate |
| Retention | User Churn Rate | Net Dollar Retention (NDR) |
| Adoption | Time in App | Breadth of Departmental Usage |
| Value | Session Frequency | Business ROI / Task Completion Rate |
Identifying Leading Indicators That Predict Future Revenue Growth
When evaluating product success, metrics generally fall into two categories: lagging indicators and leading indicators. Understanding the relationship between the two is critical for proactive product management.
Lagging indicators tell you what has already happened. Metrics like Monthly Recurring Revenue (MRR), Customer Churn, and Net Dollar Retention are essential for financial reporting, but they are reactive. By the time a customer churns, the product failures that caused the cancellation occurred months prior.
Leading indicators, conversely, predict future outcomes. These are the behavioral signals that indicate whether a customer is likely to renew or expand their contract. Effective leading indicators focus on the "Why" behind user behavior, such as "Time to Task Completion" or the "Frequency of Key Feature Usage."
One of the most practical frameworks for identifying leading indicators comes from product management communities. Often referred to as the "Notebook Test" or the "Side-Spreadsheet Test," this concept challenges PMs to look beyond digital analytics.
If your users are still keeping a physical notebook on their desk or running a shadow Excel spreadsheet to manage a workflow that your software is supposed to solve, your product is failing—regardless of how high your login rates are.
As discussed in expert product management forums, a high login rate can sometimes indicate frustration rather than engagement. If a user has to log in five times a day because the software is confusing or fails to save their progress, high DAU is actually a churn indicator. Instead, PMs should measure Feature Displacement—the rate at which your software successfully replaces legacy tools and manual workflows.
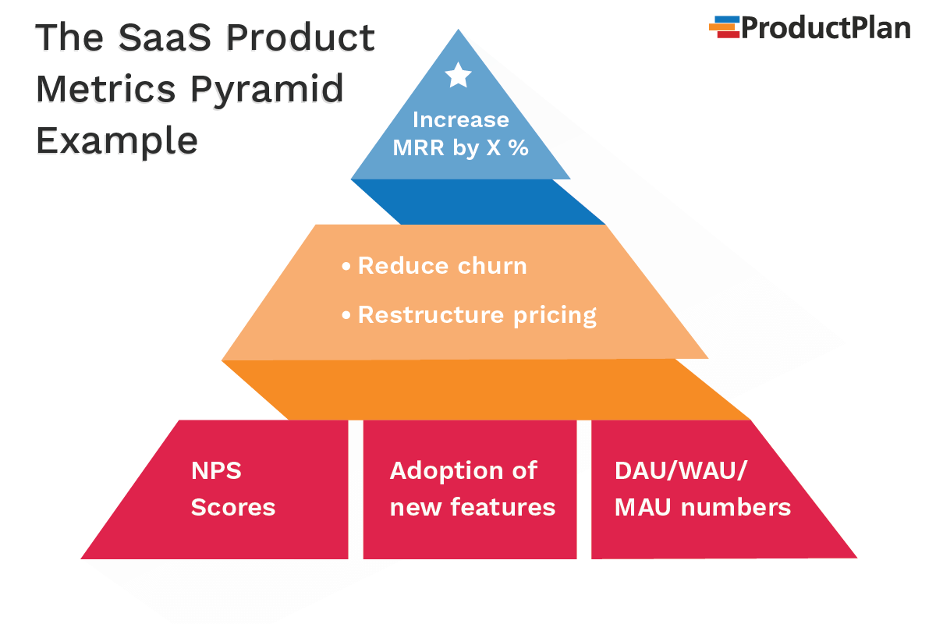
Image source: Smartlook
Essential Metrics for Every Stage of the B2B Customer Journey
To build a comprehensive dashboard, product metrics must be mapped to the customer journey. A user in their first week requires entirely different success criteria than an enterprise account in its third year of a contract.
How to Measure Activation and Time to Value
Activation is the critical bridge between marketing acquisition and product retention. It measures the percentage of new accounts that successfully complete a predefined set of actions that deliver core value.
According to Userpilot's 2025/2026 SaaS Product Metrics Benchmark Report, the average activation rate for B2B SaaS stands at 37.5%. However, this varies significantly by industry. AI and Machine Learning tools often see activation rates exceeding 54%, driven by immediate novelty and rapid output, while complex HR Tech platforms may struggle with activation rates below 10% due to extensive integration requirements.
Closely tied to activation is Time to Value (TTV). This metric tracks the duration between a customer signing a contract and experiencing their first meaningful business result. The industry average TTV is approximately 36 hours (1 day, 12 hours), though CRM tools typically achieve this faster than data infrastructure platforms.
Do not confuse technical setup with product activation. Connecting an API or importing a CSV file is a setup task—it provides zero emotional or business value to the user. The true "Aha!" moment occurs when the user sees the first automated report generated from that data. Your activation metric must track the latter.
Tracking Engagement and Product Stickiness
Once an account is activated, the focus shifts to habitual usage. The Stickiness Ratio (calculated by dividing Daily Active Users by Monthly Active Users) is a standard measure of engagement. While consumer apps might aim for a 50% stickiness ratio, product analytics platform PostHog notes that the SaaS average is closer to 13%. In the B2B space, a stickiness ratio of 20% or higher is generally considered a strong indicator of healthy adoption.
However, stickiness must be contextualized by the product's intended use case. A payroll processing tool is naturally only used a few times a month; a low DAU/MAU ratio for such a tool is normal and does not indicate churn risk. Conversely, a team communication tool requires a high daily stickiness ratio to remain viable.
Retention and Expansion Metrics That Investors Actually Care About
For mature B2B SaaS companies, acquisition metrics take a backseat to retention and expansion economics. Investors and board members evaluate product success through the lens of capital efficiency and account growth.
Net Dollar Retention (NDR) is widely regarded as the "North Star" metric for B2B SaaS. It measures the revenue retained from existing customers over a specific period, factoring in upgrades, cross-sells, downgrades, and cancellations. An NDR above 100% means the product is so valuable that existing accounts are spending more money over time, organically offsetting any revenue lost to churn.
Additionally, financial infrastructure provider Stripe highlights the importance of tracking Customer Concentration Risk. If a product team builds features exclusively to satisfy one massive "whale" account that represents 30% of total ARR, the product roadmap becomes compromised. Monitoring concentration ensures the product remains viable for the broader market rather than devolving into custom consulting software.

Image source: ProdCamp
How to Use Data Science to Find Your Product Aha Moment
Many product teams rely on intuition to define their "Aha! Moment" (the specific action that correlates with long-term retention). Instead of guessing, teams should utilize data science techniques to mathematically prove which features drive loyalty.
The most effective approach is the Correlation Method. By analyzing historical user data, product analysts can identify which specific actions have the highest statistical correlation with 90-day retention or paid conversion. As detailed by business intelligence platform Metabase, this involves moving beyond basic event tracking and utilizing SQL functions to find predictive patterns.
For example, using the CORR function in SQL allows teams to plot the relationship between "Event X" (e.g., inviting a team member) and "Outcome Y" (e.g., renewing an annual contract).
-- Example SQL structure for finding feature correlation
SELECT
    feature_name,
    CORR(times_feature_used_first_week, retained_after_90_days) AS correlation_coefficient
FROM
    user_activity_log
GROUP BY
    feature_name
ORDER BY
    correlation_coefficient DESC;
A correlation coefficient approaching 1.0 indicates a strong positive relationship. If data shows that accounts creating at least three custom dashboards in their first 48 hours have a 90% renewal rate, "creating three dashboards" becomes the mathematically proven activation metric.
Furthermore, timing is critical. Data consistently shows an "Aha" Window—a brief period during which activation must occur. For most B2B SaaS platforms, if a user does not experience core value within the first 2 to 3 days of onboarding, the probability of long-term retention drops precipitously, regardless of how many follow-up emails are sent.
Comparing B2B and B2C Product Metric Strategies
Applying B2C growth hacks to a B2B product is a common recipe for failure. The structural differences in how software is purchased and utilized necessitate entirely different measurement strategies.
First, the Sales Cycle Impact alters how velocity is measured. A consumer app measures time-to-conversion in minutes. A B2B enterprise platform measures it in months. Therefore, B2B teams must track intermediate milestones, such as Lead Velocity Rate (LVR) and the progression of accounts through Proof of Concept (POC) stages, as noted by B2B marketing experts.
Second, B2B products must satisfy two distinct audiences simultaneously: The Decision Maker and The End User.
- The Decision Maker (The Buyer): Cares about ROI, compliance, reporting, and cost reduction. Metrics targeting this persona include automated report generation frequency and license utilization rates.
- The End User (The Operator): Cares about UI efficiency, speed, and making their daily job easier. Metrics targeting this persona include time-to-task completion and reduction in manual data entry.
A product that delights the end user but fails to provide ROI reporting to the decision maker will likely be canceled at renewal. Conversely, a product that looks great to executives but is miserable for employees to use will suffer from low adoption and eventual churn. A balanced metrics framework tracks value delivery for both personas.
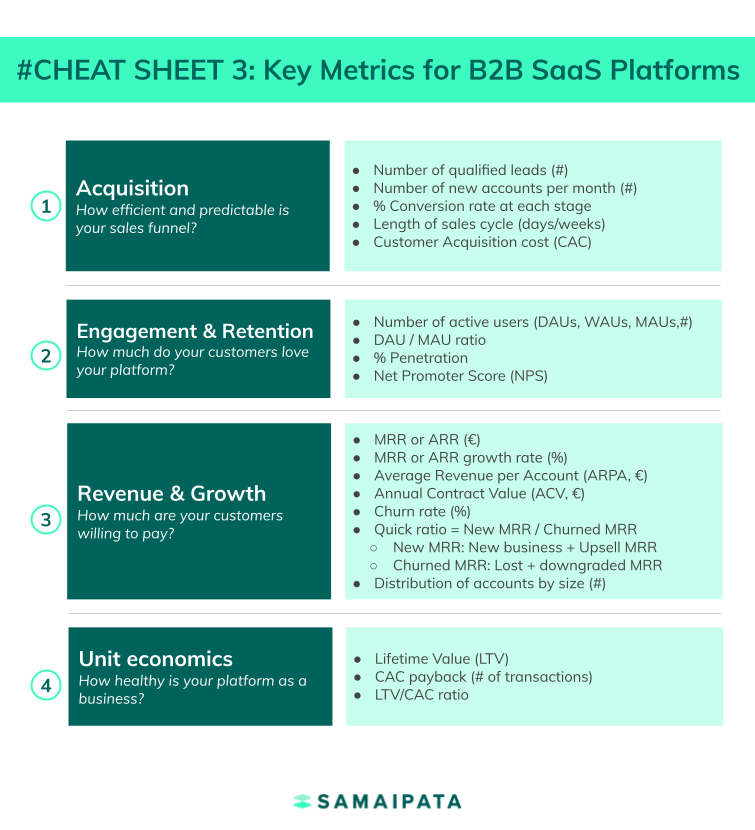
Image source: Samaipata VC
Frequently Asked Questions
What is a good activation rate for B2B SaaS?
How do B2B product metrics differ from B2C?
What is the "North Star" metric for B2B SaaS?
How do you calculate Net Dollar Retention (NDR)?
(Starting MRR + Expansion MRR - Downgrade MRR - Churn MRR) / Starting MRR * 100. For example, if you start with $100,000 in MRR, gain $20,000 in upgrades, lose $5,000 to downgrades, and lose $10,000 to churn, your NDR would be 105%.
What product metrics do investors look for in B2B SaaS?
The Bottom Line
Transitioning from vanity metrics to a robust B2B SaaS measurement framework requires a fundamental shift in perspective. By moving away from individual user dopamine hits and focusing on account-level ROI, product teams can build features that drive actual revenue retention. To align your product strategy with sustainable growth, implement these core takeaways:
- Define your "Aha! Moment" mathematically: Stop guessing. Use SQL correlation functions to identify the exact product actions that historically lead to 90-day retention.
- Audit your "Side-Spreadsheet" risk: Conduct user interviews specifically to find out if customers are still using Excel or paper notebooks to bypass clunky workflows in your software.
- Build an Account Health Score: Aggregate individual user data into a single organizational metric that measures both the breadth (seats used) and depth (features used) of adoption.
- Benchmark your Time to Value (TTV): Measure your onboarding speed against the 36-hour industry average, ensuring users experience core value within the critical 2-3 day window.
- Prioritize Net Dollar Retention (NDR): Shift your product roadmap focus from acquiring new logos to expanding the footprint and value delivery within existing enterprise accounts.
Review your current analytics dashboard today and replace at least one user-level vanity metric with an account-level leading indicator.