What Are the Top Product Searches on Google and How Can You Sell Them?
As of 2026, the top product searches on Google are heavily concentrated in the $500 billion wellness and practical home goods sectors. High-growth search queries include mouth tape (134% YoY growth), flat back earrings (65% YoY growth), and sleep bonnets (64% YoY growth). Success in e-commerce today relies on identifying "Step-Up Trends"—products that show continuous, sustained search volume growth—rather than chasing temporary social media fads. By leveraging Google Trends data alongside advanced search operators, retailers can validate consumer demand before investing in inventory.
The landscape of e-commerce product discovery has shifted significantly. In previous years, dropshippers and online retailers often relied on viral social media spikes to dictate their inventory. However, as the market matures into 2026, data indicates that sustainable retail success requires a more analytical approach. According to recent market analysis, investment strategies built around long-term search trends have outperformed traditional retail models by 2% to 3%.
Finding the top product searches on Google is not about uncovering a secret hack; it is about timing the right waves. The US wellness sector alone exceeds $500 billion in annual spending, growing at a steady 4% to 5% year over year. Consumers are actively turning to search engines to solve specific, daily frictions—from improving sleep quality to finding more comfortable jewelry.
In this comprehensive analysis, we will explore exactly which products are dominating Google search volumes in 2026, the consumer psychology driving these queries, and a step-by-step methodology for using Google Trends and advanced search operators to validate your next product launch.
Which Products Are Trending Most on Google Right Now?
To understand what consumers are searching for, we must look beyond raw search volume and focus on year-over-year (YoY) growth velocity. High search volume with stagnant growth often indicates a saturated market dominated by legacy brands. Conversely, high-velocity growth points to emerging consumer needs where new sellers can establish a foothold.
Based on aggregated search data and consumer behavior reports, the top product searches in 2026 fall into three distinct categories: The Wellness Wave, Safety & Comfort, and Practical Sleep Solutions.
The Wellness Wave: Mouth Tape and Sauna Blankets
The wellness sector continues to be a dominant force in search data. Leading this category is mouth tape, which has seen an extraordinary 134% YoY growth in search interest. Originally a niche biohacking concept, mouth taping has transitioned into mainstream sleep hygiene. Consumers are searching for hypoallergenic, medical-grade tapes designed specifically to encourage nasal breathing during sleep.
Similarly, portable wellness tech like sauna blankets has maintained strong search momentum. These products appeal to the 16% of consumers who, according to Deloitte's consumer psychology data, base their "splurge" purchases entirely on the desire for relaxation and stress relief.
The "Safety & Comfort" Niche: Flat Back Earrings
One of the most fascinating search trends of 2026 is the rise of flat back earrings, which have experienced a 65% YoY growth. This trend is driven by a significant demographic shift: over 30% of Americans born since the mid-70s have at least one piercing, compared to less than 10% of those born in the 1960s.
Traditional butterfly-back earrings often cause discomfort during sleep or physical activity. Flat back earrings (frequently searched under the synonym "safety back earrings" by parents shopping for children) solve a specific, painful friction point. This taps directly into the 21% of consumers who prioritize physical comfort when making purchasing decisions.
Practical Sleep Solutions: Sleep Bonnets and Blue Light Therapy
Sleep optimization extends beyond mouth tape. Sleep bonnets have seen a 64% increase in search volume. Once primarily found in beauty supply stores catering to specific hair types, silk and satin sleep bonnets have seen broadened search interest as a universal solution for reducing hair friction and preserving hairstyles overnight.
Additionally, blue light therapy devices (growing at 38% YoY) and sustainable home goods like glass straws (maintaining a steady 18% growth) round out the list of top-performing search categories.
| Product Name | YoY Search Growth | Primary Consumer Driver | Market Category |
|---|---|---|---|
| Mouth Tape | 134% | Health & Optimization | Sleep Hygiene |
| Flat Back Earrings | 65% | Physical Comfort | Jewelry / Accessories |
| Sleep Bonnets | 64% | Practicality & Preservation | Beauty & Personal Care |
| Blue Light Therapy | 38% | Relaxation & Mood | Wellness Tech |
| Glass Straws | 18% | Sustainability | Home Goods |
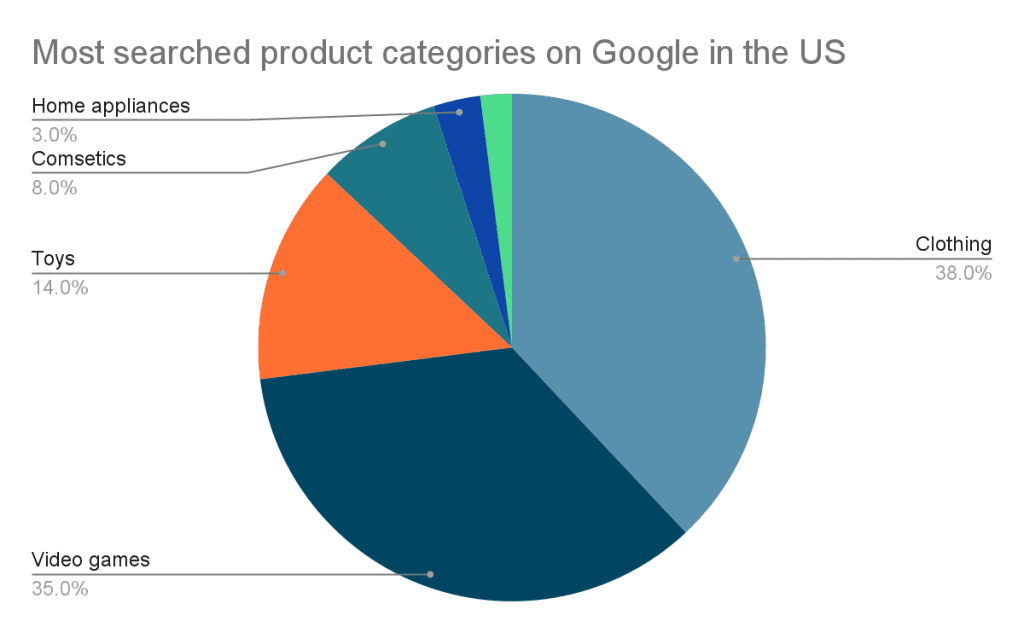
Image source: clickvision
How to Tell the Difference Between a Viral Fad and a Sustainable Trend
One of the most common pitfalls for e-commerce entrepreneurs is misinterpreting a temporary media spike as a long-term market shift. Investing inventory capital into a fad can leave you with unsellable stock once the internet's attention moves on. To mitigate this risk, sellers must learn to read the nuances of Google Trends data.
Success in e-commerce is less about finding secret hacks and more about timing the right waves. You want the underlying wave of consumer demand to do the heavy lifting for your business.
When analyzing a product's search history on Google Trends, you are looking at a 0–100 popularity scale. This scale represents relative search interest over time, not absolute search volume. A score of 100 represents the peak popularity for that term within the selected timeframe. By setting the timeline to "Past 5 Years," you can easily distinguish between two distinct patterns:
- The "Rollercoaster" (Media Spike)
- This pattern is characterized by a sharp, nearly vertical climb to 100, followed by an equally rapid descent back to near zero. Rollercoasters are typically driven by a viral TikTok video, a celebrity endorsement, or a temporary cultural moment (e.g., fidget spinners). These are highly risky investments because the demand evaporates as quickly as it appeared.
- The "Step-Up Trend" (Sustainable Growth)
- A Step-Up Trend may also feature spikes in interest, but the critical difference lies in the recovery. After a spike, the search volume does not return to zero; instead, it settles at a higher baseline than before the spike occurred. This indicates that the product has achieved permanent market penetration and represents a permanent shift in consumer behavior.
For example, while a product like "glass straws" shows a flatter trajectory with 18% growth, it represents a stable, continuous growth curve. It is a reliable, low-risk addition to a home goods catalog, even if it lacks the explosive virality of a rollercoaster product.
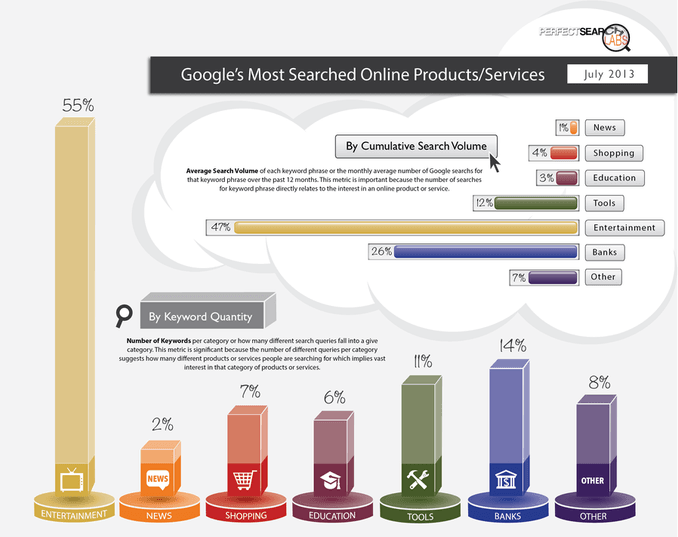
Image source: Perfect Search Media
A Step-by-Step Workflow to Find Winning Products Using AI and Google Trends
Relying solely on pre-published lists of trending products means you are often arriving late to the market. To gain a competitive advantage, you need a proactive methodology for product discovery. By combining the brainstorming capabilities of Large Language Models (LLMs) with the hard data validation of Google Trends, you can identify emerging niches before they become saturated.
This multi-step strategy, often referred to as the "Prompt-to-Product" framework, allows you to systematically uncover high-potential search queries.
Step 1: The LLM Brainstorm
Instead of asking an AI for "trending products," ask it to identify "High-Optionality" subcategories based on consumer friction points. Use a prompt like: "List 20 physical products that allow consumers to shift daily chores to evening hours, focusing on the wellness and home organization niches."
Step 2: The Google Trends Validation
Take the AI-generated list and input each item into Google Trends. Set the timeframe to "Past 5 Years." You are looking for two things: a Step-Up Trend pattern and seasonal predictability. For instance, if the AI suggests "weighted yoga mats," check if the search volume reliably spikes every January (New Year's resolutions) and maintains a higher baseline each subsequent year.
Step 3: The Vocabulary Check
Consumers often use different terminology than manufacturers. Use the "Compare" feature in Google Trends to test synonyms. For example, compare "hair dryer brush" against "blowout brush." You must optimize your product listings for the exact vocabulary your target demographic is typing into the search bar, as noted by e-commerce experts.
Understanding Seasonality vs. Fads
During Step 2 of the workflow, it is crucial to differentiate between a fad and a seasonal product. Seasonal products (like inflatable pools or heated blankets) will show a rollercoaster pattern, but that pattern will repeat predictably at the exact same time every year. Seasonal products are highly profitable if you time your inventory acquisition correctly, whereas fads are unpredictable and dangerous.
How to Validate TikTok Trends Using Google Search Data
In 2026, social media platforms like TikTok are the primary engines for product discovery, but Google remains the primary engine for product intent. Understanding the relationship between these two platforms is key to finding top product searches.
TikTok operates on a "push" algorithm—users are passively shown products they didn't know existed. Google operates on a "pull" algorithm—users actively search for products they have decided to buy. Because of this dynamic, there is often a delay between a product going viral on social media and that product peaking in search volume on Google.
This delay creates what e-commerce strategists call the "SEO Window."
When a product like mouth tape first began circulating on social media, it generated massive view counts. However, savvy retailers didn't just look at the view counts; they monitored Google Trends. They waited to see if the social media curiosity would translate into actual commercial search intent. Once the Google search volume began its 134% climb, it validated that the TikTok trend had "legs" and was transitioning into a mainstream consumer habit.
If a product has billions of views on social media but flatlines on Google Trends, it usually means consumers find the product entertaining to watch but have no actual desire to purchase it. Always use search data to validate social media hype.
Image source: Perfect Search Media
Advanced Search Techniques to Spy on Your E-commerce Competition
Finding a product with high search volume is only half the battle; you must also assess the competition. If a product has massive search volume but is dominated by entrenched, high-authority brands, it will be incredibly difficult for a new seller to rank organically or achieve profitable ad spend.
To gauge keyword difficulty and spy on your retail competitors, you can use advanced Google search operators. These commands force the search engine to filter results in highly specific ways.
The Competition Spying Checklist
- Run an
allintitle:search: Typeallintitle:"flat back earrings"into Google. This operator tells Google to only return pages that have that exact phrase in their meta title. The number of results shown gives you a highly accurate estimate of how many SEO competitors are actively targeting that specific product keyword. - Run an
allinurl:search: Typeallinurl:"sleep bonnet" + "shop". This filters the results to show only pages with the product name and the word "shop" in the URL structure, helping you identify direct retail competitors rather than informational blogs. - Analyze the pricing spread: Review the top 10 organic results from your
allinurl:search to determine the average market price and identify gaps where you could offer a premium or budget alternative.
Bypassing "AI Slop" with the udm=14 Parameter
As AI-generated content has proliferated, many search results for product reviews have become cluttered with generic, unhelpful affiliate articles. To find out if consumers actually like a trending product, you need to read authentic human discussions.
According to discussions in the Google Search Help Community, power users have adopted a specific URL parameter to filter out standard web pages and only show forum results (like Reddit and Quora). By appending &udm=14 to the end of a Google search URL (or using the built-in "Web" filter), you strip away the standard retail and affiliate sites.
Using this trick to search for "mouth tape side effects" or "flat back earrings review" will surface raw, unfiltered customer sentiment. If the forum discussions are overwhelmingly negative, the high search volume might be driven by customer complaints rather than purchase intent—a massive red flag for any potential seller.
Frequently Asked Questions
What products are trending on Google right now?
How do I find the most searched items on Google for free?
What is the difference between a "trending" product and a "top-selling" product?
How often does Google Trends update its product data?
How do I use Google Trends for dropshipping?
The Bottom Line
Finding the top product searches on Google requires moving beyond basic search volume and analyzing the velocity, sustainability, and intent behind the queries. By applying a data-driven approach, you can identify profitable niches before they become saturated.
- Target the Wellness Sector: Focus on the $500B health and comfort market, which consistently produces high-growth queries like mouth tape and sleep bonnets.
- Identify Step-Up Trends: Use the 5-year view on Google Trends to ensure a product's search volume settles at a higher baseline after a spike, avoiding temporary fads.
- Validate Social Media: Never invest in a TikTok trend until you see corresponding commercial search intent rising on Google.
- Check Keyword Difficulty: Always run an
allintitle:search to gauge exactly how many competitors are actively targeting your specific product phrase. - Analyze Real Sentiment: Use the
udm=14parameter (or Web filter) to read authentic Reddit and Quora discussions, ensuring the high search volume isn't driven by customer complaints. - Optimize Vocabulary: Compare synonyms in Google Trends to ensure your product listings match the exact terminology consumers are typing.